Profitable Betting Strategies Through Sports Statistics and Data Analysis
Sports statistics and data analysis form the backbone of profitable betting strategies by enabling informed, fact-based decisions instead of emotional reactions. I rely on advanced statistical models and performance metrics to uncover valuable opportunities and stay ahead of bookmakers.
Key Takeaways
- Data-driven betting decisions consistently outperform intuition-based choices by removing emotional bias from the decision-making process.
- Essential performance indicators like points per possession, shooting percentages, and turnover rates provide more insight than basic win-loss records.
- Understanding probability concepts and odds formats is crucial for calculating expected value and identifying profitable betting opportunities.
- Sport-specific statistics and metrics require different analytical approaches across basketball, football, baseball, and soccer.
- Common analytical mistakes include overfitting statistical models and confusing correlation with causation when interpreting data.
The Role of Statistical Analysis in Betting
Statistical analysis transforms raw data into actionable insights. I focus on key performance metrics specific to each sport while monitoring broad trends that impact betting markets. Advanced analytics help identify undervalued teams and players that casual bettors might overlook.
Predictive Models Based on Historical Data
My approach combines historical data with current performance indicators to create predictive models. These models factor in elements such as team matchups, player injuries, and game conditions. Regular testing and refinement of these models ensure continued accuracy and relevance in dynamic markets.
Pattern Recognition and Market Efficiency
Pattern recognition through data helps highlight profitable opportunities. I closely monitor line movements and market inefficiencies across multiple sportsbooks. This systematic approach produces better results than relying solely on instinct or popular opinion.
Sport-Specific Analytical Approaches
Each sport demands a unique analytical lens:
- Baseball statistics emphasize individual matchups and situational performance.
- Basketball analysis focuses on pace, efficiency, and possession-based metrics.
- Football requires evaluation of both team strategies and individual statistics.
- Soccer analysis often revolves around goal-scoring probabilities and possession dynamics.
Avoiding Common Statistical Mistakes
Proper interpretation of statistics is vital to prevent common betting errors. I avoid making conclusions from limited data sets and remain cautious of confusing correlation with causation. This disciplined statistical mindset is essential for long-term sports betting success.
Why Data-Driven Betting Decisions Outperform Gut Instinct
Statistics provide the foundation for making smart betting choices by removing emotional bias from the decision-making process. I’ve found that relying on concrete performance metrics, rather than hunches, leads to more consistent long-term success in sports betting.
The Power of Statistical Analysis
Professional bookmakers employ teams of statistical experts (quants) who create sophisticated mathematical models to set their odds. This data-driven approach helps them maintain a profitable edge — and as a bettor, I need to adopt similar analytical methods to find real value. While casual bettors often make snap judgments based on recent memories or personal biases, successful sports betting requires a systematic approach to analyzing betting fundamentals.
Common Emotional Traps to Avoid
One frequent mistake I see is overvaluing home teams without statistical justification. While home-field advantage exists, its impact varies significantly across different sports, venues, and situations. Instead of automatically backing the home team, I recommend examining specific metrics that indicate true performance advantages.
Here’s what to focus on when making data-driven betting decisions:
- Track specific performance indicators like points per possession, shooting percentages, and turnover rates rather than just win-loss records
- Study head-to-head matchup statistics between teams over multiple seasons
- Monitor injury reports and their statistical impact on team performance
- Analyze trends in different bet types like spreads and totals under various conditions
- Compare your projected odds to the market to identify value opportunities
The most profitable bettors don’t rely on gut feelings about which team “should” win. Instead, they build statistical models that can spot small but meaningful edges in the betting markets. By focusing on data analysis and removing emotion from the equation, I can make more objective decisions that pay off over time.
Remember that even a slight statistical edge, consistently applied across many bets, can lead to long-term profitability. That’s why professional bettors spend so much time analyzing data rather than following hunches or popular opinion. The key is developing a systematic approach based on proven statistical methods rather than emotional reactions to recent games or media narratives.

Essential Statistical Concepts Every Bettor Must Know
Statistical understanding forms the backbone of successful sports betting. I’ll guide you through the key concepts that’ll help sharpen your betting strategy.
Understanding Probability and Odds Formats
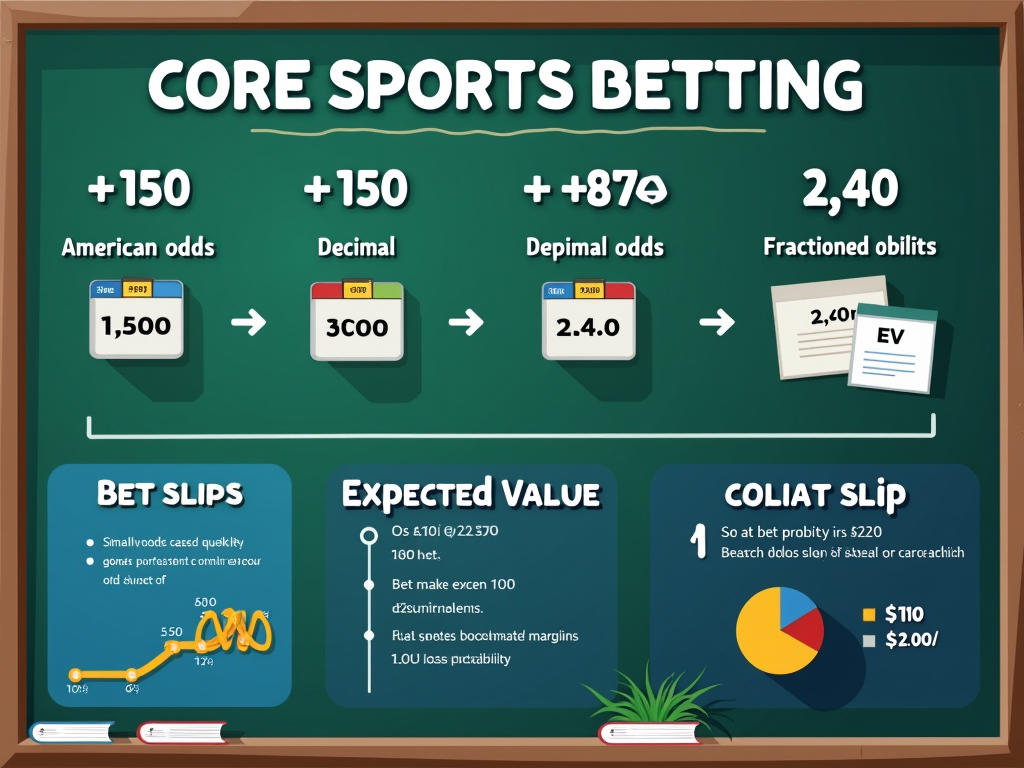
Probability acts as the foundation of sports betting, measured from 0 to 1 (0% to 100%). Before placing your first bet, I recommend getting comfortable with three main odds formats in sports betting:
- American odds: Displayed as +150 (underdog) or -150 (favorite)
- Decimal odds: Shown as 2.50
- Fractional odds: Written as 6/4
Converting between these formats helps you spot value across different sportsbooks. For instance, to find the implied probability from decimal odds, simply divide 1 by the decimal number. A decimal odd of 2.00 converts to 50% probability (1/2.00 = 0.50).
Expected Value and Bookmaker Margins
Expected Value (EV) calculation helps determine if a bet offers long-term profit potential. I’ve found that positive EV bets consistently outperform random selections. Let’s break down the math: multiply your win probability by potential profit, then subtract the product of loss probability and stake.
Bookmakers add their profit margin (vig) of 4-10% to the true probability. This means the total probability of all possible outcomes exceeds 100%. For example, in standard moneyline bets, two equal probability outcomes (50% each) might be priced at 1.90 decimal odds instead of the fair 2.00.
Here’s a practical example:
- Bet: $10
- Win Probability: 50%
- Odds Offered: 2.20 (decimal)
EV Calculation: (0.50 x $12 profit) – (0.50 x $10 stake) = $1
This indicates a potentially profitable bet, though remember that short-term results can vary significantly from the mathematical expectation.
Understanding these statistical concepts helps you make informed decisions when analyzing betting opportunities. By calculating implied probabilities and Expected Value, you’ll start recognizing value bets that others might miss.

Key Statistics and Metrics Across Major Sports
Essential Performance Indicators by Sport
Understanding sport-specific statistics is crucial for making smart betting decisions. I’ve found that tracking these numbers can give you a significant edge in understanding sports betting fundamentals.
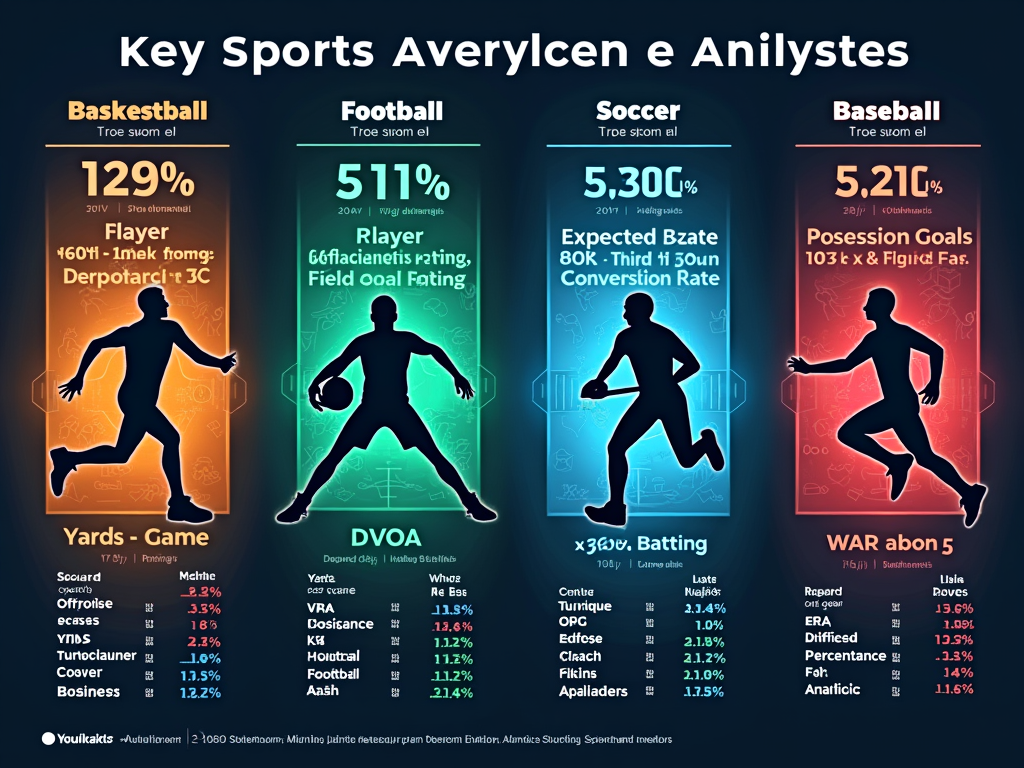
Basketball performance relies on several core metrics that paint a complete picture of team and player effectiveness. The league average Offensive Rating hovers around 115, while a Player Efficiency Rating (PER) of 15.0 marks the baseline for average performance. These stats help inform valuable prop bet opportunities.
In football, success often boils down to these key measurements:
- Yards per Game (YPG) for offensive production
- Turnover Differential to gauge team discipline
- DVOA for comparing teams across different schedules
- Third Down Conversion Rate for offensive efficiency
Soccer betting requires attention to specific indicators that predict success. Expected Goals (xG) above 2.0 typically signals a strong attacking team, while consistent high possession percentages can indicate control over matches. These metrics support making informed moneyline and spread decisions.
Baseball offers some of the most detailed statistics in sports. A .300 batting average shows exceptional hitting skill, while an OBP of .400 or higher indicates elite plate discipline. For pitchers, an ERA and FIP below 3.50 suggest superior performance. The WAR stat is particularly telling—any player above 5 is performing at an All-Star level.
I’ve learned that focusing on efficiency metrics rather than raw totals provides better insight into true performance. These advanced statistics help cut through surface-level numbers and reveal genuine value for making smarter betting choices.
For example, while Points per Game in basketball might grab headlines, the Field Goal Percentage often tells a more reliable story about offensive effectiveness. Similarly, in baseball, looking beyond basic stats like home runs to examine Fielding Independent Pitching can uncover hidden betting value.

Powerful Analysis Tools for Sports Bettors
Essential Data Sources and Basic Tools
Sports betting success starts with reliable data sources. I’ve found that free platforms like ESPN Stats deliver comprehensive statistics across multiple sports. Sport-specific reference sites serve as goldmines of historical data – Basketball-Reference, Baseball-Reference, and Pro-Football-Reference pack decades of detailed player and team statistics that can shape fundamental betting strategies.
For beginners diving into sports betting analysis, Excel and Google Sheets stand out as practical starting points. These tools help create basic statistical models and perform essential calculations. I recommend starting with:
- Win-loss record analysis
- Point differential calculations
- Head-to-head matchup tracking
- Player performance trends
- Basic probability calculations
Advanced Analysis Methods and Tools
Taking analysis to the next level means diving into sophisticated tools and methods. Programming languages like R and Python shine here – they’re perfect for creating custom betting models and handling large datasets. These platforms excel at regression analysis, helping predict game outcomes based on multiple variables.
I’ve seen significant value in applying Poisson distribution modeling to predict scoring patterns, particularly useful for totals betting. Monte Carlo simulations add another layer of precision by running thousands of game scenarios to estimate probable outcomes. This becomes particularly valuable when analyzing prop bets and special markets.
Data visualization tools transform complex statistics into clear, actionable insights. Whether using specialized software or programming libraries, creating visual representations helps spot trends that raw numbers might miss. I’ve found that heat maps, scatter plots, and trend lines make it easier to identify betting opportunities and manage risks effectively.

Critical Mistakes to Avoid in Sports Data Analysis
Data Interpretation Errors
I’ve found that one of the biggest pitfalls in sports betting analysis is overfitting statistical models. While it’s tempting to create a model that perfectly explains past results, this approach often fails to predict future outcomes accurately. Think of it like studying only the questions from last year’s exam – you’ll excel at those specific problems but struggle with new ones.
Another common trap is mixing up correlation with causation. Just because two statistics move together doesn’t mean one causes the other. For instance, a team’s win percentage might increase when their star player wears blue socks – but that’s likely just coincidence, not a winning strategy.
Context and Bias Management
Let me point out the essential factors that many bettors overlook when analyzing sports data:
- Confirmation bias traps – cherry-picking stats that support your existing beliefs while ignoring contradictory data
- Weather conditions that can significantly impact game outcomes
- Player injuries and team dynamics that numbers alone can’t capture
- Small sample sizes that can lead to misleading conclusions
I’ve learned that understanding betting fundamentals goes beyond pure statistics. While analyzing sports data wisely is crucial, it’s the combination of quantitative and qualitative analysis that creates winning strategies.
Raw numbers can’t tell the whole story. A team’s recent performance might look great on paper, but factors like travel schedules, roster changes, or team chemistry issues could paint a different picture. That’s why I always recommend looking beyond the basic stats when placing common betting types.
The key is maintaining a balanced approach. While data analysis is vital for making informed betting decisions, it shouldn’t be your only tool. I’ve seen too many bettors fall into the trap of relying solely on statistics without considering the human elements that influence sports outcomes.
Sources:
ESPN Stats & Info
Basketball-Reference.com
Baseball-Reference.com
Pro-Football-Reference.com
FBref.com
Football Outsiders
Opta Sports
StatsBomb


